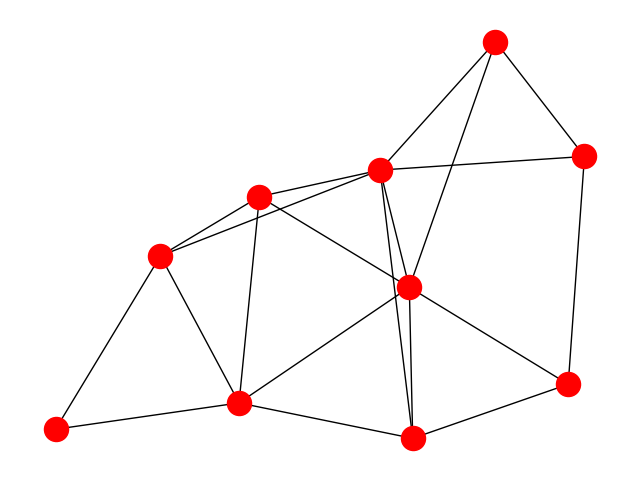
Erdos Renyi
Create an G{n,m} random graph with n nodes and m edges and report some properties.
This graph is sometimes called the Erdős-Rényi graph but is different from G{n,p} or binomial_graph which is also sometimes called the Erdős-Rényi graph.
Out:
node degree clustering
0 2 1.000000
1 4 0.666667
2 3 0.666667
3 3 0.333333
4 4 0.500000
5 4 0.500000
6 6 0.400000
7 3 0.333333
8 5 0.400000
9 6 0.333333
#/home/docs/checkouts/readthedocs.org/user_builds/cole-maclean-networkx/checkouts/update-geometric-networks/examples/graph/plot_erdos_renyi.py
# GMT Thu Aug 24 23:38:05 2017
#
0 8 5
1 8 9 5 6
2 9 6 7
3 4 6 7
4 8 9 6
5 8 9
6 8 9
7 9
8
9
# Author: Aric Hagberg (hagberg@lanl.gov)

#    Copyright (C) 2004-2017 by
#    Aric Hagberg <hagberg@lanl.gov>
#    Dan Schult <dschult@colgate.edu>
#    Pieter Swart <swart@lanl.gov>
#    All rights reserved.
#    BSD license.

import sys

import matplotlib.pyplot as plt
from networkx import nx

n = 10  # 10 nodes
m = 20  # 20 edges

G = nx.gnm_random_graph(n, m)

# some properties
print("node degree clustering")
for v in nx.nodes(G):
    print('%s %d %f' % (v, nx.degree(G, v), nx.clustering(G, v)))

# print the adjacency list to terminal
try:
    nx.write_adjlist(G, sys.stdout)
except TypeError:  # Python 3.x
    nx.write_adjlist(G, sys.stdout.buffer)

nx.draw(G)
plt.show()
Total running time of the script: ( 0 minutes 0.169 seconds)